Description:
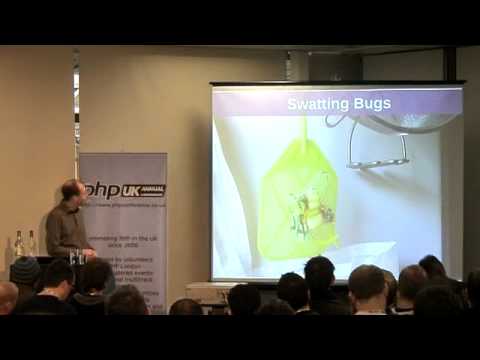
Explore the powerful debugging tool Xdebug in this comprehensive conference talk from PHP UK Conference 2011. Delve into error messages, CMS errors, and various features that enhance PHP development. Learn how to effectively use Xdebug, including turning it on, understanding its bidirectional nature, and leveraging browser extensions. Discover techniques for debugging sessions, profiling, and working with kcashcrunch. Gain insights into automatic readable formats, HTML traces, and strategies for swatting bugs efficiently. By the end of this talk, master the art of PHP debugging and optimize your development workflow with Xdebug.

Xdebug
Add to list
#Conference Talks
#PHP UK Conference
#Programming
#Programming Languages
#PHP
#Web Development
#Browser Extensions
#Xdebug