Description:
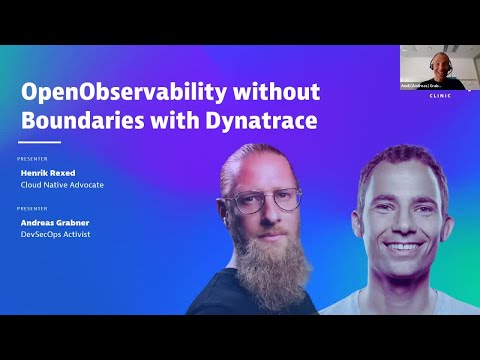
Explore open observability without boundaries in this comprehensive webinar. Discover how to ingest and connect observability data from various sources like Prometheus, FluentBit, and OpenTelemetry. Learn to analyze data using DQL, Dynatrace Notebooks, and Dashboards, and automate daily tasks through data-driven workflows. Gain insights into OpenTelemetry, Fluentbit, and their differences. Witness live demonstrations of OpenTelemetry and Fluentbit implementations, as well as Dynatrace's capabilities for open observability. Understand key concepts such as business metrics from telemetry and observing the observer metrics. By the end, grasp essential takeaways for implementing comprehensive observability in your systems.

OpenObservability Without Boundaries with Dynatrace
Add to list