Description:
Explore the practical implementation of monitoring a JHipster microservice architecture in this 25-minute conference talk by Pierre Besson, a JHipster core team member. Dive into the JHipster Console, a 100% open-source monitoring solution, and discover how to leverage logs, metrics, and traces to gain valuable operational insights. Learn how this Elasticsearch-based tool, which integrates the ELK stack and Zipkin, can simplify debugging and scaling of microservices. Gain hands-on knowledge through demonstrations covering application overview, frontend tests, log filtering, metrics visualization, request dashboards, and tracing data analysis using the Zipkin UI. Understand how to identify and troubleshoot request errors, ultimately enhancing your ability to observe and control production systems in the age of microservices and DevOps.
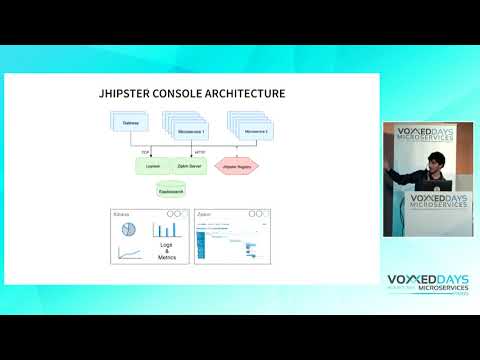
Monitoring a JHipster Microservice Architecture in Practice
Add to list
#Conference Talks
#Devoxx
#Computer Science
#Software Engineering
#Scalability
#Data Science
#Big Data
#Elasticsearch
#ELK Stack
#DevOps
#Observability
#Distributed Tracing
#Zipkin