Description:
Dive into a comprehensive 57-minute video tutorial on fundamental statistical concepts. Learn to calculate and interpret key measures such as mean, median, mode, range, interquartile range, quartiles, and percentiles. Master the identification of outliers and the construction of various data visualization tools including box and whisker plots, histograms, frequency tables, dot plots, and stem and leaf plots. Explore relative frequency, cumulative relative frequency, and their application in percentile determination. Gain insights into data distribution skewness, distinguishing between symmetric, positively skewed, and negatively skewed distributions. Enhance your statistical analysis skills with practical examples and clear explanations, preparing you for more advanced statistical concepts and applications.
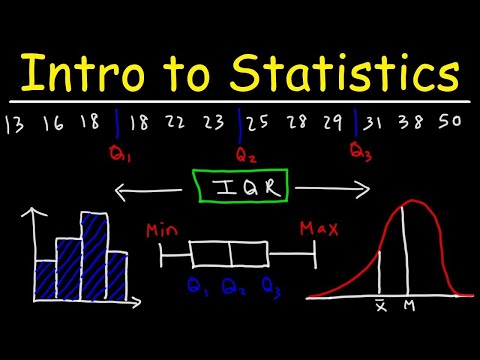
Introduction to Statistics
Add to list
#Mathematics
#Statistics & Probability
#Data Science
#Data Analysis
#Data Visualization
#Measures of Central Tendency