Description:
Learn how to enhance your Node-RED dashboard with a data table in this 20-minute video tutorial. Install the table node package and explore its functionality using real-world data examples. Follow along as the instructor demonstrates installing the table node, reviewing documentation, creating static example data, and adding the table to the dashboard. Discover techniques for retrieving real-world data, setting dynamic properties, updating single rows, and configuring table settings. Explore advanced features such as adding additional rows, limiting row numbers, and emptying the table. Gain practical skills to create informative and interactive data tables for your Node-RED projects.
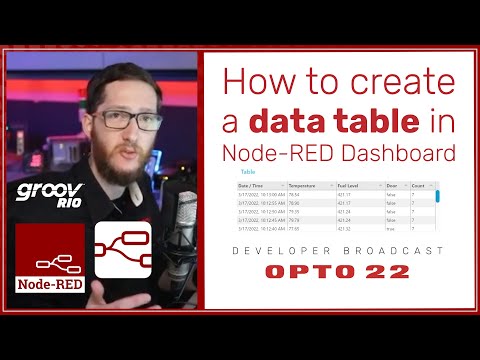
How to Create a Data Table in Node RED Dashboard
Add to list
#Programming
#Programming Languages
#Javascript
#Node.Js
#Node-RED
#Computer Science
#Internet of Things
#Data Science
#Data Visualization