Description:
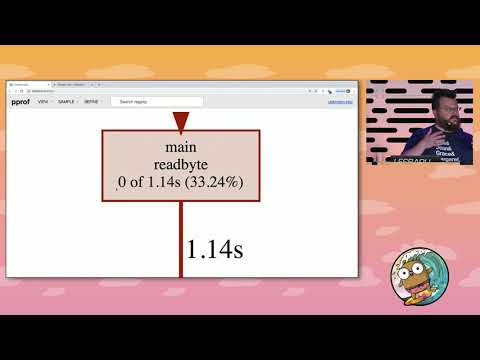
Explore three different profiling techniques for Go programs in this 43-minute conference talk from GopherCon 2019. Learn how to diagnose and improve performance by examining CPU and memory usage, as well as execution traces. Discover the practical applications of Amdahl's Law while analyzing various programs, including a word count example. Gain insights into interpreting profile comparisons, understanding memory allocation patterns, and identifying potential leaks. Master the skills needed to optimize Go code efficiently and write high-performance applications.

Two Go Programs, Three Different Profiling Techniques
Add to list
#Conference Talks
#GopherCon
#Programming
#Programming Languages
#Go
#Computer Science
#Memory Management
#Memory Allocation
#Computer Architecture
#CPU Profiling
#Software Development
#Memory Profiling