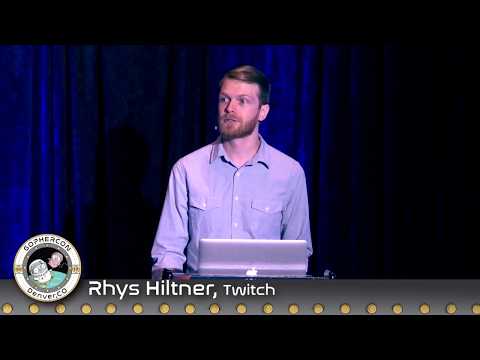
Description:
Explore the execution tracer (go tool trace), one of Go's most powerful diagnosis tools, in this conference talk from GopherCon 2017. Learn how to leverage this complex yet invaluable tool to understand goroutine interactions in great detail, uncover latency bugs, and identify logical races. Dive into topics such as correct and effective concurrency management, parallelism exploitation, and timing-dependent bugs. Discover how to use the -race flag for testing, building, and installing Go programs. Examine trace views, sync blocking profiles, and goroutine analysis techniques. Gain insights into Go's garbage collection improvements, including parallel threads and Stop-The-World pauses. Understand the challenges of large heaps and awkward pauses in user code. Prepare yourself by practicing with these essential tools to enhance your Go programming skills and optimize your concurrent applications.

An Introduction to Go Tool Trace
Add to list
#Conference Talks
#GopherCon
#Programming
#Programming Languages
#Go
#Computer Science
#Concurrency
#Race Conditions