Description:
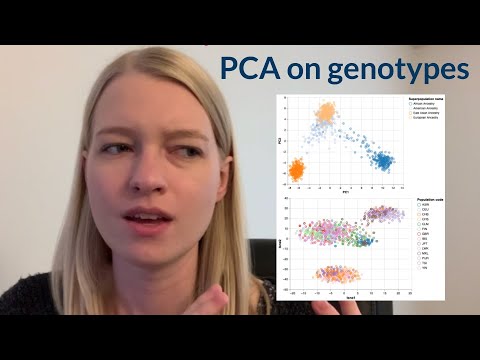
Embark on a comprehensive bioinformatics project walkthrough that explores the relationship between genes and geography through population genotype data analysis. Learn to run Principal Component Analysis (PCA) and t-Distributed Stochastic Neighbor Embedding (t-SNE) on genetic data from the 1000 Genomes project. Follow step-by-step instructions to download and parse VCF files using pysam, create numpy arrays, and utilize pandas for data manipulation. Transition between Python scripts and Google Colab environments while mastering visualization techniques with both matplotlib and Altair. Gain insights into population genetics by coloring data points based on ancestry labels and merging additional population information. Conclude with an exercise on performing PCA on SNPs and discover the origin story behind this illuminating project.
Genes and Geography - A Bioinformatics Project
Add to list
#Data Science
#Bioinformatics
#Data Analysis
#Programming
#Programming Languages
#Python
#Matplotlib
#pandas
#NumPy
#Science
#Biology
#Genetics