Description:
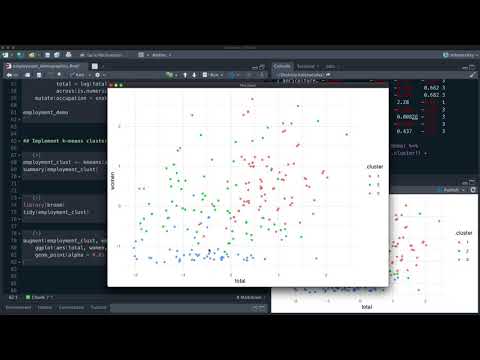
Explore demographic employment data using k-means clustering in this 28-minute screencast. Dive into #TidyTuesday data from the Bureau of Labor Statistics to uncover similarities in demographic characteristics across various roles and industries. Learn to group data, find proportions, scale numerics, and implement k-means clustering. Visualize results and gain insights into employment trends. Follow along with the provided code on Julia Silge's blog for a hands-on learning experience.
Explore Demographic Employment Data With K-Means
Add to list
#Data Science
#Data Analysis
#Data Visualization
#Computer Science
#Machine Learning
#K-Means Clustering