Description:
Dive into the world of Windows kernel mode debugging with this 32-minute conference talk from BSidesSF 2018. Explore the practical science of debugging, focusing on its crucial role in creating secure software and understanding operating system internals. Learn about the importance of kernel debugging for efficiency, root cause analysis, and crafting more secure software. Gain insights into approaching different software issues, identifying appropriate commands and tools, and understanding the internal workings of operating systems. Discover how to collect BSOD dumps, configure Live Kernel Debugging with VMware, and tackle various software problems including CPU issues, deadlocks, and blue screens. Suitable for those with an introductory C programming background and general understanding of operating systems, this talk aims to encourage exploration of kernel debugging as a core component of resilient security.
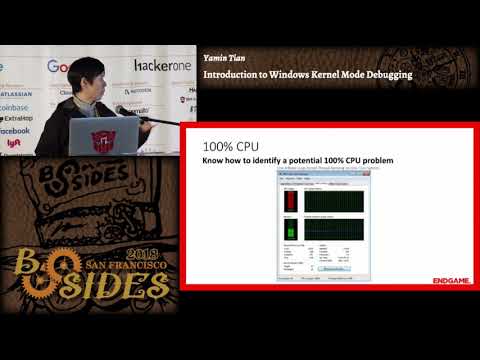
Introduction to Windows Kernel Mode Debugging
Add to list
#Conference Talks
#Security BSides
#Programming
#Software Development
#Programming Languages
#C Programming
#Information Security (InfoSec)
#Cybersecurity
#Software Security
#WinDbg