Python Charting Stocks/Forex for Technical Analysis Part 1 - Intro and stock price source
2
Python Charting Stocks/Forex for Technical Analysis Part 2 - How to get free Stock Prices
3
Python Charting Stocks/Forex for Technical Analysis Part 3 - Free intra-day stock data
4
Python Charting Stocks/Forex for Technical Analysis Part 4 - Automating stock prices
5
Python Charting Stocks/Forex for Technical Analysis Part 5 - Finishing price puller
6
Python Charting Stocks/Forex for Technical Analysis Part 6 - Basic Financial Graph
7
Python Charting Stocks/Forex for Technical Analysis Part 7 - Basic Financial Graph
8
Python Charting Stocks/Forex for Technical Analysis Part 8 - Improving our Stock Chart
9
Python Charting Stocks/Forex for Technical Analysis Part 9 - Adding Volume data to matplotlib graph
10
Python Charting Stocks/Forex for Technical Analysis Part 10 - Price and Volume Chart Matplotlib
11
Charting Stocks/Forex for Technical Analysis Part 11 - Candlestick and Volume Chart in Matplotlib
12
Charting Stocks/Forex for Technical Analysis Part 12 - Customizing Matplotlib Chart
13
Charting Stocks/Forex for Technical Analysis Part 13 - Changing candlestick shadow color matplotlib
14
Charting Stocks/Forex for Technical Analysis Part 14 - Dynamic candlestick shadow color matplotlib
15
Charting Stocks/Forex for Technical Analysis Part 15 - How to add simple moving averages matplotlib
16
Charting Stocks/Forex for Technical Analysis Part 16 - How to add SMA to matplotlib stock chart
17
Charting Stocks and Forex in python Part 17 - Overlay a stock's volume in matplotlib
18
Charting Stocks and Forex in python Part 18 - How to calculate RSI in python
19
Charting Stocks and Forex in python Part 19 - How to add RSI to matplotlib graph
20
Charting Stocks and Forex in python Part 20 - How to add RSI to matplotlib graph part 2
21
Charting Stocks and Forex Part 21 - How to calculate exponential moving average in python
22
Charting Stocks and Forex Part 22 - How to calculate MACD in python
23
Charting Stocks and Forex Part 23 - How to add MACD to matplotlib graph
24
Charting Stocks and Forex Part 24 - Enhancing our RSI on our matplotlib stock graph
25
Charting Stocks Part 25 - Customizing RSI, candlestick, MACD, and Volume matplotlib chart
26
Charting Stocks Part 26 - Using Yahoo's API for our stock price technical analysis in matplotlib
27
Charting Stocks/Forex for Technical Analysis Part 27 - Adding texts and Annotations to Matplotlib
28
Python Matplotlib Live Updating Graphs - part 1
29
Python Matplotlib Live Updating Graphs - part 2
30
Charting Stocks part 30 - Graphing intra-day stock prices unix time stamps in Python
31
Python Charting Stocks part 31 - Graphing live intra-day stock prices
32
Python Big Data Analytics & Stock Algorithmic Trading Part 1: Big Data Files
33
Python Big Data Analytics & Stock Algorithmic Trading Part 2: Back Tester
34
Python Big Data Analytics & Stock Algorithmic Trading Part 3: Adding Stats
35
Python Big Data Analytics & Stock Algorithmic Trading Part 4: Adding More Stats
36
Python Big Data Analytics & Stock Algorithmic Trading Part 5: Finishing Touches
37
How to get 64 bit installations for your 64-bit Python modules
Description:
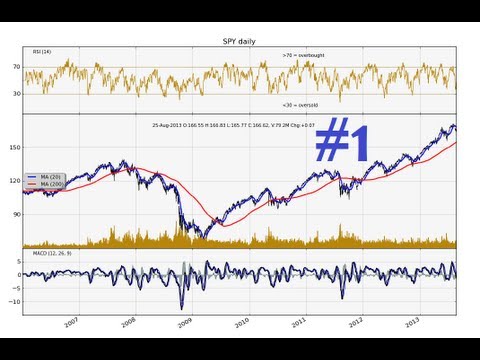
Dive into a comprehensive 6-hour tutorial series on Python-based stock and forex charting for technical analysis, big data analytics, and algorithmic trading. Learn to create sophisticated financial charts using matplotlib, including candlestick patterns, volume data, moving averages, RSI, and MACD indicators. Master techniques for automating stock price retrieval, handling intraday data, and implementing live-updating graphs. Explore big data file management and develop a backtesting system for algorithmic trading strategies. Gain practical skills in customizing charts, working with APIs, and optimizing Python installations for 64-bit systems.
Big Data Analytics and Algorithmic Stock Trading - Backtesting