Description:
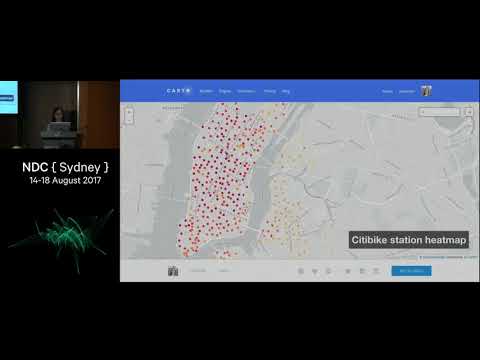
Explore the power of big data analytics in this 33-minute conference talk on analyzing 33 million bike trips using Google BigQuery. Discover how to spot trends in NYC's bike share program usage by running queries on massive datasets and creating visualizations based on different biker demographics. Learn the process of integrating findings with visualization tools and see live query demonstrations. Gain insights into applying similar analysis techniques to your own data, including examples using Github and Australian datasets. The talk also touches on Natural Language Processing applications in data analysis. Follow along as the speaker guides you through the journey from street observations to creating meaningful data visualizations, showcasing the capabilities of BigQuery as a managed big data analytics warehouse tool.

Analyzing 33 Million Bike Trips with BigQuery
Add to list
#Conference Talks
#NDC Conferences
#Data Science
#Data Analysis
#Data Visualization
#Business
#Business Intelligence
#Data Warehousing
#Programming
#Cloud Computing
#Google Cloud Platform (GCP)
#BigQuery