Mentorship Session - Tools and Techniques to Debug an Embedded Linux System
Explore essential tools and techniques for debugging embedded Linux systems, covering user space and kernel space, to improve quality and efficiently find/fix bugs.
Using the Valgrind Framework to Build a Persistent Memory Error Detector
Learn to build a persistent memory error detector using Valgrind framework. Explore design, implementation, and challenges in detecting issues with byte-addressable persistent memory programming.

Troubleshooting Native Memory Issues in Java Applications
Diagnose and resolve native memory issues in Java applications. Learn about memory pools, identifying OutOfMemoryErrors, and using tools like NMT, jemalloc, and valgrind for effective troubleshooting.
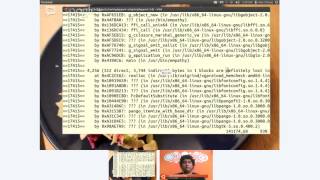
Finding Memory Leaks in Ubuntu Development
Learn to identify and fix memory leaks in Ubuntu development using tools like Valgrind. Gain practical skills for efficient coding and debugging.
Cross Debugging on Linux - History, Current State, and Future Improvements
Explore Linux cross-debugging history, current techniques, and future advancements. Learn about system modes, breakpoints, multithreading challenges, and alternatives to GDB/gdbserver.

The Aftermath of a Fuzz Run - What to Do About Those Crashes?
Explore tools and techniques for analyzing crashes from fuzz runs, focusing on reducing, triaging, and finding root causes to fix vulnerabilities in software applications.

Cold, Hard Cache - Insomniac's Cache Simulator
Explore Insomniac Games' Cache Simulator tool for optimizing CPU code performance and gaining insights into cache utilization in game development.
Go Speed Tracer - Guided Fuzzing
Explore advanced guided fuzzing techniques for vulnerability discovery, including code coverage analysis, constraint solving, and feedback mechanisms. Learn about novel tools and approaches in dynamic analysis.
Testing Complex Applications for PHP7
Comprehensive guide to testing large PHP applications, covering tools like PHPUnit, GDB, and ValGrind. Explores strategies for upgrading to PHP7 and ensuring application stability.
Introduction to Code Sanitizers
Explore code sanitizing tools for detecting memory corruptions, race conditions, and undefined behavior in programs. Learn about Valgrind, AddressSanitizer, ThreadSanitizer, and UndefinedBehaviorSanitizer.
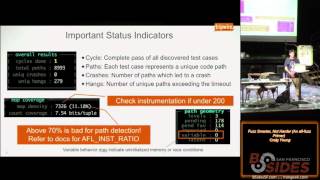
Fuzz Smarter Not Harder - An AFL Fuzz Primer
Explore advanced fuzzing techniques with AFL, including parallel and LLVM fuzzing, persistent mode, and crash assessment. Learn to optimize your fuzzing process for better vulnerability detection.
More GDB Wizardry and 8 Other Essential Linux Application Debugging Tools
Practical demonstration of advanced GDB features and essential Linux debugging tools, enhancing programming effectiveness through live demos of powerful techniques and utilities.

Modern Linux C++ Debugging Tools - Under the Covers
Explore advanced Linux C++ debugging tools, their implementation, and effective usage. Gain insights into compiler, OS, and CPU features exploited by tools like Valgrind, perf, and Address Sanitizer.

What Do You Mean by "Cache Friendly"?
Explore cache-friendly data structures and algorithms for improved performance. Learn tools and techniques to analyze and optimize cache efficiency in modern CPUs.
Optimising a Small Real-World C++ Application
Hands-on demonstration of optimizing C++ applications using measurement tools, showcasing common pitfalls and effective solutions through alternative algorithms and libraries.
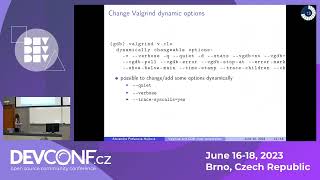
Debugging Memory Issues with Valgrind and GDB
Discover techniques for debugging memory issues using Valgrind and GDB in C/C++ programs. Learn to identify and resolve buffer overflows, memory leaks, and other low-level errors efficiently.
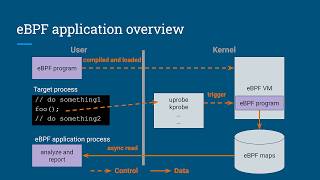
Detect C++ Memory Leaks with ALSan: Attachable Leak Sanitizer - Lecture
Discover ALSan, a new tool for detecting memory leaks in running processes without restarting. Learn how it leverages eBPF to reduce debugging time and improve issue detection.