
Zabbix - Open Source, Self Hosted Server, Network, and Device Monitoring System With Power
Learn to install and configure Zabbix, an open-source monitoring system, using Docker. Covers setup, environment variables, web UI overview, and adding client machines for comprehensive network monitoring.

Dynatrace Infrastructure Monitoring: Hosts in Action
Explore Dynatrace's host monitoring capabilities, learn about OneAgent data collection, and discover how to effectively manage and troubleshoot server performance.

Monitoreando tu Servidor Local Ubuntu con Telegraf, Grafana e InfluxDB
Aprende a monitorear eficazmente tu servidor Ubuntu utilizando Telegraf, InfluxDB y Grafana. Configura estas herramientas para recolectar, almacenar y visualizar métricas en tiempo real.

Monitor in Real-Time with OSSEC - See What’s Taking Place in Your Server
Learn to implement OSSEC for real-time server monitoring, including installation, configuration, and practical demonstrations on both Linux and Windows systems. Gain hands-on experience in intrusion detection and log analysis.

Introduction and Usage of Fine-Grain Logger, Admin Console, and HTTP Validator in Envoy
Explore Envoy's fine-grained logger, admin console features, and universal HTTP validator. Learn about runtime log control, performance insights, and consistent protocol validation across HTTP versions.
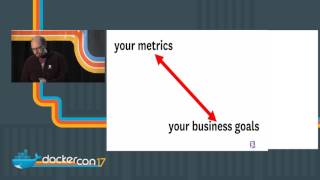
Monitoring and Optimizing the Docker Developer Lifecycle
Explore Docker monitoring techniques to gain insights into application performance, from database and server metrics to code instrumentation and optimization for production deployment.

Monitoring mit einer Kiste, aber mehreren Leuten
Effizientes Prometheus-Monitoring für private Server: Gemeinsame Infrastruktur nutzen, Kosten sparen und Ausfälle vermeiden. Praxisnahe Einführung mit Tipps zur Umsetzung.
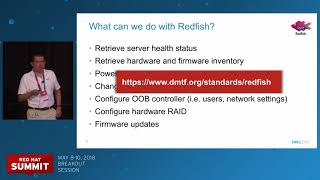
Using Ansible and Redfish to Automate Systems Management
Automate large-scale server monitoring, provisioning, and updates using Ansible and Redfish. Learn to improve IT efficiency and reduce management complexity in modern infrastructure environments.

Intrusion Detection in the Clouds
Explore cloud-based intrusion detection strategies for shared hosting environments, addressing security challenges and implementing effective monitoring solutions.
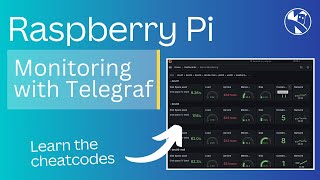
Monitoring Raspberry Pi Servers with Telegraf, Influx, and Grafana
Master server monitoring with Telegraf, Influx, and Grafana to track Raspberry Pi performance metrics and create dynamic data visualizations for effective system management.