Analyzing Postgres Performance Problems Using Perf and eBPF
Explore advanced Postgres performance analysis using perf and eBPF tools. Learn to gather detailed metrics, monitor cache hit ratios, and diagnose CPU usage for improved database optimization.
Extending the Performance Analysis Toolset for Embedded Linux Systems
Explore advanced Linux performance analysis tools for embedded devices, focusing on perf, LTTng, Hotspot, and TraceCompass. Learn to visualize data and add tracepoints to userspace applications.
Debugging Embedded Linux - Tools and Techniques
Explore embedded Linux debugging techniques, from planning to advanced tools like GDB and Wireshark. Learn to tackle hardware interactions and optimize your development process.
Dynamic Tracing Tools on ARM/AArch64 Platform - Updates and Challenges
Explore dynamic tracing tools for ARM/AArch64, including updates, challenges, and porting guides. Learn about Linux observability tools and frameworks for embedded systems and automotive platforms.
Perf Data Type Profiling and Pahole Update
Explore advanced techniques for performance data type profiling and learn about the latest updates to the pahole tool for optimizing Linux kernel development.
More GDB Wizardry and 8 Other Essential Linux Application Debugging Tools
Practical demonstration of advanced GDB features and essential Linux debugging tools, enhancing programming effectiveness through live demos of powerful techniques and utilities.
Modern Linux C++ Debugging Tools - Under the Covers
Explore advanced Linux C++ debugging tools, their implementation, and effective usage. Gain insights into compiler, OS, and CPU features exploited by tools like Valgrind, perf, and Address Sanitizer.

Introduction to Low-Level Profiling and Tracing
Explore low-level profiling and tracing tools on Linux, including ptrace, perf, SystemTap, and BCC/eBPF. Learn about their capabilities, advantages, and potential for optimizing Python performance.

BPF is Eating the World, Don't You See?
Explore BPF's growing impact on kernel operations, recent tooling improvements, and future development needs for enhanced observability and debugging capabilities.
BPF Security Auditing at Google
Explore Google's BPF security auditing approach, covering use cases, implementation details, and future developments in kernel tracing and monitoring.
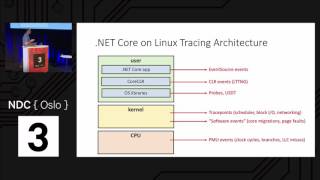
Debugging and Profiling .NET Core Apps on Linux
Explore Linux-based debugging and profiling techniques for .NET Core apps, including perf, LTTNG, and core dump analysis, to tackle production issues and optimize performance.
Investigating C++ Applications in Production on Linux and Windows
Explore advanced techniques for diagnosing and debugging C++ applications on Linux and Windows using lightweight, production-ready tools for various scenarios including high CPU load, memory leaks, and I/O issues.
Assisted Reorganization of Data Structures in Kernel Development - Kernel Recipes 2024
Explore techniques for optimizing kernel data structures using hardware-assisted profiling and automated analysis to improve cache utilization and overall performance.
Observability Tools in C++: Beyond GDB and printf
Explore advanced observability tools for C++ beyond GDB and printf to gain deeper insights into program behavior and performance on Linux systems.

Fast by Friday: Why Kernel Superpowers are Essential
Explore efficient computing methodologies using kernel technologies like eBPF to solve performance issues quickly, saving cycles and carbon while improving user experience and reducing costs.