Technical Analysis Course in Hindi for Forex, Crypto, and Stock Market
हिंदी में व्यापक तकनीकी विश्लेषण कोर्स जो फॉरेक्स, क्रिप्टो और शेयर बाजार के लिए मूल्य कार्रवाई और कैंडलस्टिक पैटर्न पर केंद्रित है। व्यावहारिक रणनीतियां और उपकरण सीखें।

Technical Analysis
Learn technical analysis for stock trading: chart patterns, indicators, volume analysis, and trading strategies to identify trends and make informed investment decisions.
Time Series
Explore time series analysis techniques including forecasting, regression, moving averages, and trend analysis for data-driven insights.
Excel Statistical Analysis - Location, Mean, Median, Mode, Moving Average, Skew & More
Comprehensive guide to Excel statistical analysis, covering mean, median, mode, moving averages, and skew. Includes practical examples using Power Query, PivotTables, and dynamic arrays for data visualization and interpretation.
Forex Strategies
Proven forex day trading strategies for successful scalping, trend following, and breakout trading. Learn technical analysis, chart patterns, and risk management techniques.

Forex Technical Analysis
Learn forex technical analysis strategies to boost profits and manage risks, covering moving averages, support/resistance, candlestick patterns, indicators, trend lines, and more for beginner to intermediate traders.
Forex Trading Course for Beginners
Learn forex trading fundamentals: account types, deposits, platforms, indicators, and strategies for beginners. Master MT4/MT5, leverage, and technical analysis.

Intermediate Day Trader
Comprehensive playlist covering day trading strategies, psychology, and techniques for becoming a profitable trader. Includes candlestick patterns, indicators, and risk management.

But What Is a Convolution?
Explore the concept of convolution in mathematics, from probability to image processing and FFTs, with clear explanations and engaging animations.

Forex Help BD Forex Profitable Strategy
ফরেক্স ট্রেডিংয়ের জন্য সহজ এবং লাভজনক কৌশলগুলি শিখুন। ইচিমোকু, মুভিং এভারেজ, আরএসআই, এবং আরও অনেক কৌশল বাংলায় ব্যাখ্যা করা হয়েছে।
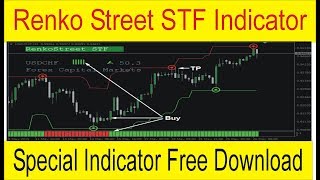
Forex Indicators
Comprehensive guide to Forex indicators, covering various strategies, tools, and techniques for effective trading in the foreign exchange market.
Getting Started with Technical Analysis 2 - Bollinger Bands and Advanced Indicators
Learn advanced technical analysis techniques including Bollinger Bands, moving averages, support/resistance lines, and candlestick patterns using Python and data science libraries for stock market analysis.
Technical Analysis: MACD and Stochastic Oscillator Using Python
Learn to use Python for stock market technical analysis, focusing on MACD and Stochastic Oscillator. Covers data retrieval, chart creation, and multiple technical indicators using various data science libraries.
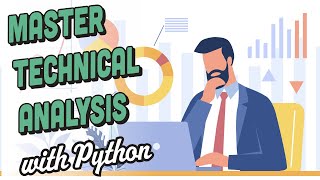
Technical Analysis with Python for Stock Market Predictions
Learn Python-based technical analysis for stock market predictions, covering data retrieval, chart patterns, moving averages, and advanced visualization techniques using data science libraries.
Time Series Analysis for Beginner Data Scientists - Time Series Forecasting
Learn time series analysis for data science: navigate, analyze, and model time series data, create forecasts, and build interactive dashboards. Ideal for beginners with basic coding skills.

Smoothing Crypto Time Series with Wavelets - Real-world Data Project
Explore real-world data science through crypto time series smoothing. Learn moving averages, polynomial fits, Fourier transforms, and wavelet decomposition techniques for financial data analysis.
DAX Visual Calculations - What You Need to Know
Explore DAX visual calculations, understanding their advantages over regular DAX for running sums and moving averages in data analysis.