
Design with Canva
Canva is a graphic design platform that is used to create social media graphics, presentations, posters, documents and other visual content. Learn how to design and create in Canva with expert help from our community team
Social Media Tutorials - Canva
Learn to create engaging social media content using Canva, from eye-catching visuals to animated posts, across various platforms like Instagram, Facebook, and YouTube.

Learn Adobe Spark
Aprende a usar Adobe Spark con Claudio Zavala Jr., quien comparte tutoriales y trucos para crear videos, infografías, logotipos y más, enfocados en mejorar la pedagogía y el éxito estudiantil.
Excel Infographic Chart Templates
Learn to create eye-catching infographics and unique visualizations in Excel, from dynamic maps to sales funnels, using creative chart techniques and templates for impactful data presentation.

Adobe Spark Tips and Tutorials
Aprende a usar Adobe Spark para crear contenido visual impactante, desde collages y tarjetas de visita hasta videos y gráficos animados, mejorando la calidad y personalización de tus proyectos.

PowerPoint Slide Design from Beginner to Expert in One Video
Master PowerPoint slide design techniques, from basic to advanced, covering layout, infographics, and animations. Transform your presentations with expert tips and creative strategies.

Curso Canva Español
Aprende a crear diseños profesionales para redes sociales, blogs y más con Canva. Domina herramientas de diseño gráfico y descubre cómo monetizar tus habilidades en línea.

Pour réussir sa vie, il faut trouver son couloir - Transformer l'échec en tremplin vers le succès
Découvrez comment transformer l'échec en tremplin vers le succès en trouvant votre voie unique. Une experte en médias sociaux partage ses insights sur l'adaptabilité et l'efficacité dans le monde digital.
Master Keynote - Essential Tips
Learn essential tips for creating stunning presentations in Apple Keynote, from choosing templates and editing layouts to adding multimedia, animations, and custom visuals. Boost your confidence and presentation skills.

Master PowerPoint - 15 Essential Tips
Learn essential PowerPoint skills to create impactful presentations, from choosing templates and editing layouts to adding multimedia elements and customizing infographics.
Data Storytelling with ComicStrips - Using ComicGen and Google Sheets
Create engaging data comic strips using Gramener's ComicGen and Google Sheets, enhancing your storytelling skills with visual narratives.
Telling India's Story One Map at a Time
Explore how data visualization and storytelling can unveil India's diverse facets, as Ashris Choudhury shares his journey of creating impactful infographics and maps to engage audiences and communicate complex societal issues.
Tableau Data Visualization Professional Tutorial
Comprehensive tutorial on Tableau data visualization, covering dashboard creation, data manipulation, best practices, and sharing techniques for effective and impactful data storytelling.

Adobe XD Masterclass - Tips and Tricks for Improved Design Workflows - Episode 18
Learn essential Adobe XD tips and tricks for designing email templates, animated buttons, infographics, and mobile device frames. Improve your workflow with plug-ins and advanced techniques.
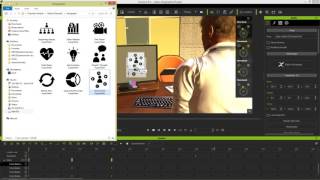
iClone 6 Demo - Super VFX 200 Pack
Explore Super VFX 200 pack for iClone 6: animated backgrounds, revealers, infographics, fire & smoke effects. Enhance video production with versatile, drag-and-drop alpha-masked elements from Digital Juice.
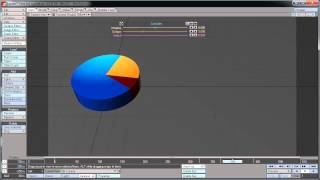
Creating a Dynamic Pie Chart Effect Using Lightwave 3D and Adobe After Effects
Learn to craft dynamic pie chart animations by combining Lightwave 3D's modeling capabilities with After Effects' motion graphics tools for visually compelling data presentations.

Monitoring at Scale - Intuitive Dashboard Design
Explore intuitive dashboard design for large-scale monitoring, focusing on cognitive science principles to create effective visualizations that aid quick decision-making and system health evaluation.

The Art and Science of Infographic Design - Balancing Creativity and Data Analysis
Master the balance between creativity and data accuracy in infographic design through real-world examples, exploring effective decision-making techniques for compelling data visualization and analytics.

Tips for Designing High-Impact Magazines
Discover 10 expert tips for creating visually striking and impactful magazine designs, from bold covers to consistent themes, enhancing your print media skills.