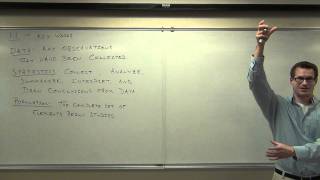
Statistics
Comprehensive video series covering fundamental statistical concepts, from data analysis to hypothesis testing, with practical examples and in-depth explanations.
Biostatistics and Research Methodology
Comprehensive exploration of biostatistics and research methodology, covering statistical concepts, sampling techniques, hypothesis testing, and research design for pharmacy students.
Frequency Distribution
Learn to create and analyze frequency distributions, including types, tables, and Excel implementation. Gain practical skills for data representation and interpretation.

Probability Basics
Learn fundamental probability concepts, distributions, and statistical techniques essential for data science and analytics.
Excel Statistical Analysis - Learn Central Limit Theorem by Building Sampling Distribution of Xbar
Explore the Central Limit Theorem through practical Excel exercises, learning to build sampling distributions and apply statistical concepts for informed business decision-making.
Excel Statistical Analysis - Frequency Distributions, Visualizations & Skew for Quantitative Data
Master frequency distributions and data visualizations in Excel, including column charts, histograms, and line charts. Learn to analyze discrete and continuous data, handle time series, and interpret skew in distributions.
Excel Statistical Analysis - Frequency Distributions & Visualizations for Categorical Data
Learn to create frequency distributions and visualize categorical data using Excel. Master PivotTables, column/bar charts, and advanced techniques for effective data presentation and analysis.
Excel Statistical Analysis - PivotTable & Power Query to Build Frequency Distributions
Master PivotTables and Power Query for creating frequency distributions from various data types. Learn efficient techniques for data import, transformation, and analysis in Excel.
PivotTables & Slicers - Create Dashboards & Summary Reports
Master PivotTables, Slicers, and dashboards in Excel. Create cross-tab reports, frequency distributions, and custom calculations for effective data analysis and visualization.
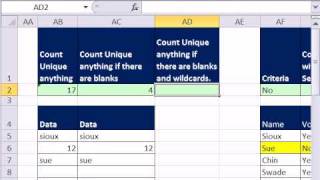
Excel Magic Trick - FREQUENCY Array Function
Comprehensive tutorial on Excel's FREQUENCY function, covering various applications from basic usage to advanced techniques for data analysis and unique item extraction.
CBSE Class 10 Term 2 Basic Math Sample Paper Full Solutions
Comprehensive video tutorial solving CBSE Class 10 Term 2 Basic Math Sample Paper, covering quadratic equations, geometry, statistics, and more. Ideal for exam preparation and concept mastery.

Introduction to Statistics in Data Science
Comprehensive introduction to key statistical concepts in data science, covering population, sampling, variables, measurement scales, and data visualization techniques.
Power Query Group By - Complete Lesson with 10 Examples
Comprehensive tutorial on Power Query's Group By feature, covering basic to advanced applications with 10 practical examples for data analysis and calculations in Excel.