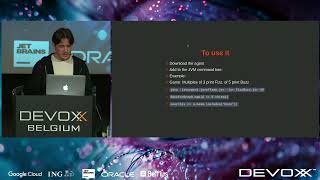
Javaflame - Capture Function Arguments and Visualize Them in a Flamegraph
Explore a powerful debugging tool for Java applications in this 32-minute conference talk from Devoxx. Learn about Javaflame, a local agent that captures function calls, arguments, and return values, presenting them in an interactive flamegraph format. D…

From Slow to Go: Rails Test Profiling Hands-On
Hands-on workshop on optimizing Rails test suite performance, covering profiling techniques and tools to identify and fix bottlenecks for faster CI/CD pipelines.
xprobes: Hybrid User/Kernel eBPF Probes for Cross-Layer Observability
Explore xprobes, a hybrid eBPF technology combining uprobes and kprobes for enhanced performance diagnostics. Learn how xprobes provide cross-layer visibility, enabling precise attribution of latency to specific functions and system events.
Production Profiling - What, Why and How
Explore production profiling techniques to solve performance issues, conduct capacity planning, and gain insights into your application's behavior in real-world environments.
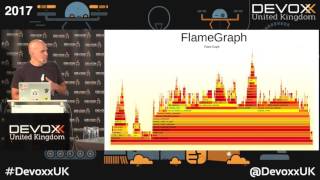
Using FlameGraphs to Illuminate the JVM
Explore FlameGraphs for JVM profiling, combining Linux perf and JDK options to visualize execution profiles across OS, JVM, and Java code. Learn advanced usage and insights into performance optimization.
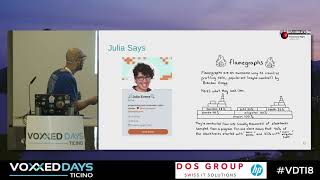
Set Your Code on Fire with FlameGraphs
Explore FlameGraphs as a visual tool for analyzing application performance, uncovering hidden JVM behaviors, and understanding profiler limitations in this insightful presentation.
Python Profiling State of the World
Explore various open-source Python profiling technologies, their tradeoffs, and visualization methods like flow charts, call trees, and flamegraphs in this hands-on workshop.
Workshop - How to Use Flamegraphs to Find Performance Problems
Discover how to use flamegraphs to identify and solve performance issues in Ruby applications, enhancing user experience and improving site reliability.
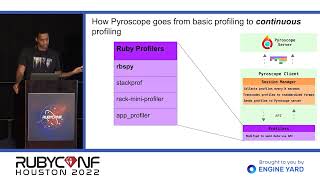
A Tale of Two Flamegraphs - Continuous Profiling in Ruby
Explore Pyroscope, a fast-growing profiling gem combining rbspy and speedscope. Learn its internals and how to use flamegraphs for analyzing application performance.

Using Rust for Numerical Applications
Explore Rust's potential for numerical applications, covering optimization techniques, benchmarking, testing, and integration with Python for high-performance scientific computing.
Boosting Kafka Performance with JVM Optimization
Optimize Kafka performance by leveraging Azul Prime JVM. Reduce latency by 40%, improve SLAs, and lower infrastructure costs through efficient JVM utilization.

Remote Debugging with Livebook - ElixirConf EU 2023
Explore remote debugging in Elixir using Livebook, OTP distribution, and module reloading. Learn to leverage smartcells, eprof, and flamegraphs for effective troubleshooting of remote instances.
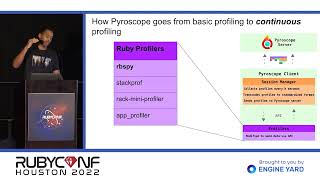
A Tale of Two Flamegraphs - Continuous Profiling in Ruby
Explore Pyroscope gem's internals, combining rbspy and speedscope for advanced Ruby profiling and performance analysis using flamegraphs.
Profiling Mastery - Decode Your Data and Elevate Observability
Master profiling fundamentals, flamegraph interpretation, and open-source tools to enhance application performance monitoring and observability in cloud-native environments.