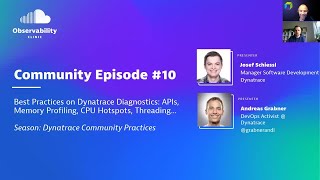
Dynatrace Diagnostics: CPU, Thread, and Memory Profiling for Developers - Episode 10
Explore Dynatrace diagnostics for developers: CPU, thread, and memory profiling. Hands-on demos guide you through identifying and fixing code hotspots, enhancing application performance.

Profiling and Optimization in UE4 - Unreal Indie Dev Days 2019 - Unreal Engine
Comprehensive guide to performance optimization in Unreal Engine, covering CPU and GPU profiling, bottleneck identification, and strategies for improving game efficiency.
Optimizing React Native: Tools and Tips
Discover tools and techniques for optimizing React Native apps, enhancing performance and user experience through efficient coding practices and profiling methods.

Deep Dive into Android Studio Profilers - Optimizing App Performance
Comprehensive guide to optimizing app performance using Android Studio Profilers, featuring in-depth demos of CPU, memory, and network profiling tools for developers.
HiSilicon Performance Monitor Control Unit - Offloading PMU Accesses
Offloading PMU accesses to PMCU for non-intrusive CPU monitoring on Kunpeng SoC. Discusses implementation challenges, synchronization issues, and seeks community feedback on use cases and interfaces.
xprobes: Hybrid User/Kernel eBPF Probes for Cross-Layer Observability
Explore xprobes, a hybrid eBPF technology combining uprobes and kprobes for enhanced performance diagnostics. Learn how xprobes provide cross-layer visibility, enabling precise attribution of latency to specific functions and system events.
Container Performance Analysis and Optimization
Explore container performance analysis techniques, including resource-oriented analysis, noisy neighbor identification, and specialized tooling for Docker environments. Gain insights into Netflix's approach to optimizing microservices.

Python Performance Matters
Explore Python's unique performance challenges and discover Scalene, a cutting-edge profiler offering faster, more accurate, and actionable insights for optimizing CPU, GPU, and memory usage.
Profiling CPU and Memory on Linux, with Opensource Graphical Tools
Learn to profile CPU and memory on Linux using open-source graphical tools like heaptrack and hotspot. Discover efficient ways to identify performance bottlenecks and memory allocation issues in your applications.
Leveraging Prometheus' TSDB for Conprof - Continuous Profiling
Explore conprof, an open-source tool for continuous profiling. Learn how it adapts Prometheus' time-series database for efficient storage and analysis of CPU and memory profiles over time.

Tackling Performance Issues with YourKit
Learn to identify and solve performance bottlenecks using YourKit profiler. Explore real-world examples, analyze CPU and memory usage, and discover unexpected issues in your code.
Scalene - A High-Performance, High-Precision CPU+GPU+Memory Profiler for Python
Discover Scalene: a revolutionary Python profiler offering unparalleled speed and precision for CPU, GPU, and memory analysis, with unique features like GPU profiling and memory leak detection.

Two Go Programs, Three Different Profiling Techniques
Explore three profiling techniques for Go programs to diagnose and improve performance, including CPU and memory profiling, execution tracing, and understanding Amdahl's Law.

Go Profiling and Observability from Scratch
Explore Go profiling and observability tools to optimize performance, reduce costs, and debug issues. Learn about runtime internals, built-in profilers, and advanced techniques for efficient Go application development.
Self-Aware Applications - Automatic Production Monitoring
Explore techniques for building self-aware Windows applications that can monitor, diagnose, and recover from issues autonomously, using ETW, performance counters, and CLRMD for enhanced reliability.
Zero-Instrumentation Observability Based on eBPF - Conf42 SRE 2024
Explore zero-instrumentation observability using eBPF for modern systems. Learn about collecting telemetry data, leveraging eBPF, and implementing metrics, traces, and CPU profiling without code changes.
Optimizing LLM Efficiency One Trace at a Time on Kubernetes
Discover how to optimize LLM deployments on Kubernetes using OpenTelemetry's profiling features to identify resource bottlenecks, improve performance, and reduce operational costs through efficient monitoring.