Data Visualization in Python - Altair Scales, Axes, and Legends - Lecture 4
Master Altair's scales, axes, and legends for effective data visualization in Python. Learn to customize charts, enhance readability, and extract insights using advanced techniques and color encoding.
Data Visualization in Python - Altair Data Preparation Techniques
Explore data preparation techniques in Altair for effective visualization, including aggregation, binning, time unit transforms, and filtering to shape and analyze your data effectively.
Data Visualization in Python - Building Blocks of Altair - Tutorial Series Part 2
Explore Altair's fundamental components for data visualization in Python, including data types, graphical marks, and visual encoding channels. Learn to create interactive and customizable charts.
Data Visualization in Python - Altair 4.2 Tutorial
Comprehensive tutorial on Altair for data visualization in Python, covering setup, basic plots, customization, interactivity, and advanced features. Ideal for beginners and intermediate users.
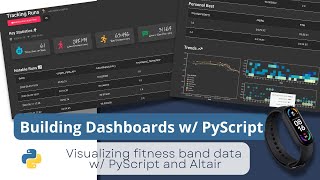
Building Dashboards with PyScript and Altair - Part 1
Learn to build interactive dashboards using PyScript, Altair, and Pandas. Create visually appealing data visualizations from fitness tracker data with step-by-step guidance on data processing and chart customization.
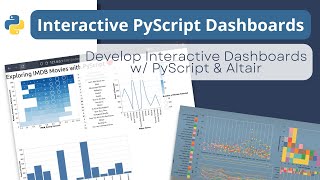
Building an Interactive Dashboard with PyScript and Altair - Tutorial 3
Learn to create an interactive dashboard using PyScript and Altair, from setup to deployment. Covers importing dependencies, building visualizations, and deploying the final product on GitHub Pages.
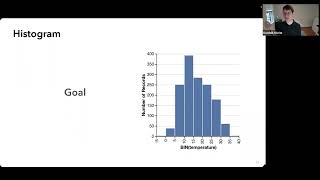
Vega: Layered Abstractions for Data Visualizations
Explore Vega's ecosystem of declarative visualization languages and interactive tools for creating rich, interactive visualizations with layered abstractions and flexible designs.
How to Create Beautiful Interactive GUIs and Web Apps
Learn to create interactive GUIs and web apps using streamlit in Python. Hands-on exercises cover basics, data visualization, custom layouts, and integration with popular libraries for effective data science projects.
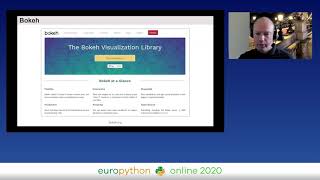
The Python Data Visualization Landscape in 2020
Explore Python's data visualization libraries including Matplotlib, Plotly, Bokeh, and Altair. Learn about dashboarding solutions like Dash, Panel, and Voila, and understand their key features and recent developments.

Python and Data Storytelling - Avoiding Deaths by PowerPoint
Explore innovative Python tools and data storytelling techniques to create engaging, interactive presentations that captivate audiences and enhance information retention.