Description:
Explore the intricacies of visualizing data using 7-segment displays in this informative 34-minute video. Delve into topics such as two's complement, Boolean algebra, and the double dabble algorithm. Learn how to simplify equations, convert algebra to logic gates, and implement computer-assisted design. Discover the process of creating a digit display design, understanding binary coded decimal, and implementing the double dabble algorithm with logic gates. Gain insights into displaying 8-bit numbers, implementing ripple blanking, and handling negative number visualization. Follow along as the final design is tested and refined, providing a comprehensive understanding of data visualization techniques for digital displays.
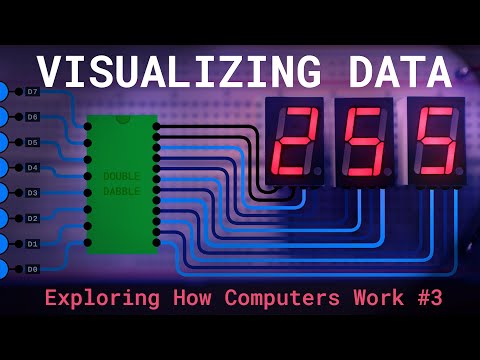
Visualizing Data with 7-Segment Displays
Add to list
#Computer Science
#Data Science
#Data Visualization
#Engineering
#Electronics
#Mathematics
#Discrete Mathematics
#Boolean Algebra
#Computer Architecture
#Logic Gates