Description:
Discover the power of Notion's new chart feature in this comprehensive 50-minute video tutorial. Learn to create and customize nine different chart types, from simple bar charts to complex multi-series visualizations. Master techniques for grouping data, using formulas to drive pie charts, and analyzing sales trends with line charts. Explore practical examples like tracking tasks per project, visualizing team workload, and identifying top customers. Gain insights into Notion Charts FAQs and access additional resources, including data sets and related tutorials, to enhance your Notion skills. Perfect for beginners and experienced users alike, this guide equips you with the knowledge to leverage Notion's charting capabilities for more effective data visualization and analysis.
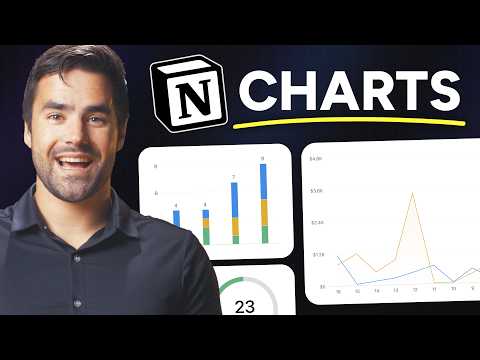
The Ultimate Guide to Notion Charts - 9 Examples
Add to list
#Business
#Business Software
#Notion
#Programming
#Databases
#Business Intelligence
#Data Science
#Data Analysis
#Data Visualization
#Project Management
#Personal Development
#Self Improvement
#Productivity
#Spreadsheets
0:00 / 0:00