Description:
Learn to create stunning ggplot2 bar charts in R, from basic to advanced techniques. This 28-minute tutorial covers creating R Notebooks from Kaggle datasets, cleaning column names with Janitor, and mastering ggplot2 bar chart creation. Discover the advantages of geom_col over geom_bar, how to flip coordinates, reorder bars, add labels, and apply powerful themes using ggthemes. Utilize a Kaggle crime dataset to practice these skills and elevate your data visualization capabilities in R.
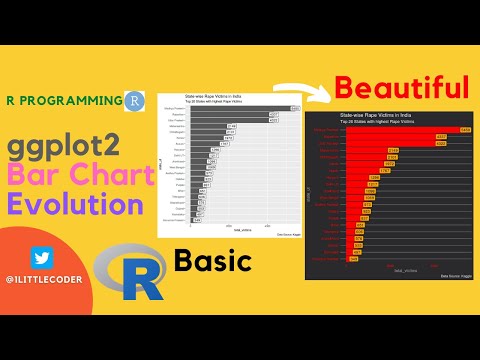
Make a Beautiful Ggplot2 Bar Chart from Basic to Powerful Themes
Add to list
#Data Science
#Data Visualization
#Programming
#Domain-Specific Languages (DSL)
#R Programming
#Data Analysis
#Data Cleaning
#ggplot2
#Computer Science
#Machine Learning
#Kaggle
0:00 / 0:00