Description:
Learn advanced Excel techniques for creating a Data Model with DAX formulas to build a PivotTable Frequency Distribution with Conditional Formatting in this comprehensive tutorial. Discover how to work with big data using Data Models and DAX formulas, create a CountCategory table, build DAX measures, import data into the Data Model, and create an automatic calendar table in Power Pivot. Explore table relationships, filter contexts, and how to optimize DAX formulas for large datasets. Master the creation of calculated columns, sorting techniques, and frequency formulas using COUNTROWS. Apply slicers, conditional formatting, and dashboard design to enhance data visualization. Download the provided start and finished files to follow along and practice these powerful Excel skills.
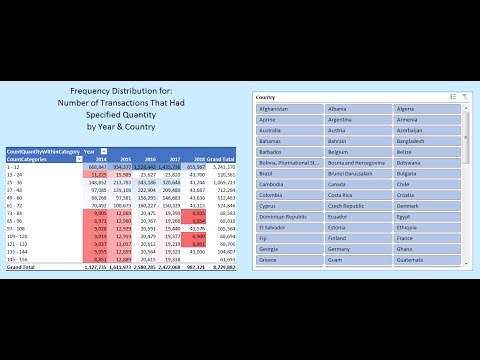
Data Model & DAX Formulas - Quantity Frequency Distribution by Year & Country
Add to list
#Business
#Business Software
#Microsoft Office 365
#Microsoft Excel
#Data Science
#Big Data
#Data Analysis
#Business Intelligence
#DAX (Data Analysis Expressions)
#Programming
#Databases
#Database Design
#Data Modeling
#Data Models
#DAX Formulas
#Spreadsheets
#PivotTables
0:00 / 0:00