Description:
Learn how to create beautiful graphs and plots using LaTeX and the pgfplots package in this comprehensive tutorial video. Explore techniques for generating 2D graphs, scatter plots, bar charts, 3D surface plots, and 3D line plots. Master the art of formatting plot elements and axes to achieve precise control over your visualizations. Discover how to customize plot colors, styles, marks, and samples, as well as adjust axis bounds, labels, and titles. Delve into advanced topics such as adding text nodes, importing data for scatter plots, and creating color-coded visualizations. Gain insights into using Overleaf as a LaTeX editor and leverage its version history feature. By the end of this tutorial, you'll have the skills to produce professional-quality graphs and plots seamlessly integrated with your LaTeX documents.
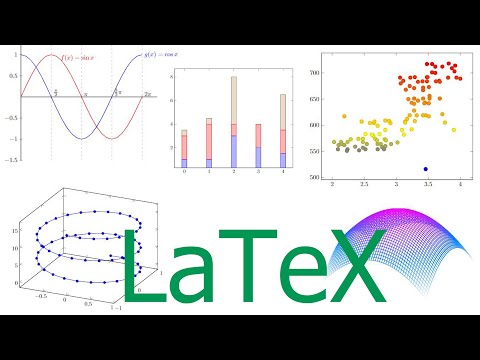
How I Make Beautiful Graphs and Plots Using LaTeX
Add to list
#Programming
#Domain-Specific Languages (DSL)
#LaTeX
#Data Science
#Data Visualization
#Bar Charts
#Scatter Plots
0:00 / 0:00