Description:
Explore the intricacies of JVM performance optimization through FlameGraphs in this 52-minute Devoxx conference talk. Dive into the powerful combination of Linux system profiler perf and JDK 8u60's -XX:+PreserveFramePointer option to capture comprehensive profiles across OS, JVM, and Java code. Learn how to visualize execution profiles, analyze Java applications from new perspectives, and gain insights into profiling techniques. Discover the utility of FlameGraphs in various scenarios, including jstack and honest-profiler usage, perf-map-agent integration, and advanced applications. Uncover the impact of compilers and garbage collection on performance profiles, and explore additional advanced FlameGraph usage techniques. Benefit from speaker Nitsan Wakart's expertise in Java development, trading systems, and JVM performance optimization as you enhance your understanding of this innovative profiling method.
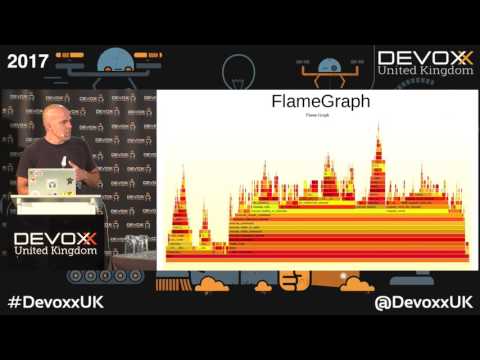
Using FlameGraphs to Illuminate the JVM
Add to list
0:00 / 0:00