Description:
Explore the design philosophy and architecture of Prometheus, the powerful monitoring system and time series database, in this 40-minute talk by Julius Volz. Delve into the Prometheus server's functionality, data model, and label-based approach. Understand its non-sequel nature and binary arithmetic capabilities. Compare pull vs. push methodologies, examine alternatives, and learn about operational bottlenecks and clustering. Gain insights into Prometheus' integration with Ethernet through a live demonstration. Discover why Prometheus has become a cornerstone for monitoring distributed applications in the Docker ecosystem, enabling developers and system administrators to efficiently manage and scale their infrastructure.
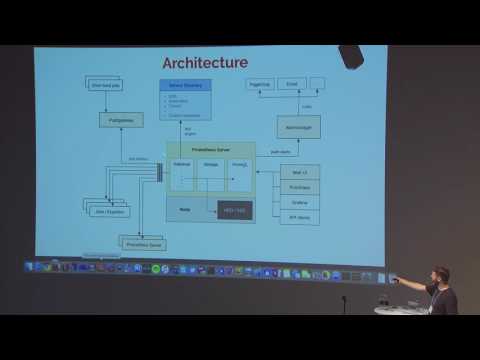
Prometheus - Design and Philosophy - Why It Is the Way It Is
Add to list
#Conference Talks
#DockerCon
#Data Science
#Data Visualization
#Computer Science
#DevOps
#Prometheus
#System Administration
#Programming
#Databases
#Time Series Databases
0:00 / 0:00